SQL WHILE Loops can be a convenient way to add various amounts of mock data to a table for testing. But the WHILE Loop itself can also be a good way to test different functionality within SQL Server itself. When using a WHILE Loop to insert hundreds of thousands of rows, you might find it taking a lot longer than you expect; even minutes just to insert half a million narrow rows. Now of course this could be caused by any number of issues, but in this post I am going to focus on a particular cause of the WRITELOG wait type that I recently ran in to.
Setup
Lets start with a simple example. First create a simple example table.
CREATE TABLE [dbo].[MyTable](

[Id] [int] IDENTITY(1,1) NOT NULL,

[SomeText] [varchar](10) NULL,

[MoreText] [varchar](50) NULL

) ON [PRIMARY]
Then execute a WHILE Loop that will insert 500k records.
TRUNCATE TABLE dbo.MyTable
DECLARE @Iterations int = 500000
DECLARE @Counter int = @Iteration
WHILE @Counter > 0
BEGIN
INSERT INTO [dbo].[MyTable]
([SomeText]
,[MoreText])
VALUES
('Num:' + CONVERT(varchar,@Counter)
,CONVERT(varchar,@Counter) + ' bottles of beer on the wall')
SET @Counter = @Counter - 1
END
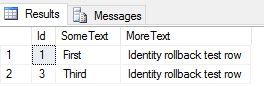
SELECT *
FROM dbo.MyTable
Your results will vary, but for me that took ~ 1 minute on an otherwise idle Core i7 laptop with 16GB of RAM and an SSD – a lot longer than you might expect.
Why So Slow?
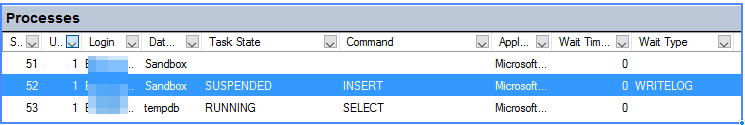
Well, lets first take a look at Activity Monitor while we run the above script again. It will TRUNCATE and reload the table. You’ll see that after a few seconds the INSERT query gets suspended with a Wait Type of WRITELOG.
What is WRITELOG?
The WRITELOG wait type occurs while, wait for it…, “waiting for a log flush to complete. Common operations that cause log flushes are checkpoints and transaction commits.” Ok, so what is a log flush? Without going too far off topic here, we need to very quickly discuss a bit about the SQL Server Transaction Log (much more detail here).
When data in SQL Server is modified, the first thing that happens is SQL checks if the needed data page is in memory, and if not, it reads it from disk into memory. Once the required data page is stored in memory, the changes are applied, and the changes are written to the Log Buffer, also in memory, which stores log records until they are written to disk. Before being able to write the “dirty” pages to the data files on disk, first the Log Buffer records must be “flushed” and written to disk in the log file itself. It is at this point where the WRITELOG wait type is encountered as more log flushes for more data changes occur.
Per Paul Randal, log flushes basically occur when either a transaction is committed, or when the maximum of 60KB of log records have been generated since the last log flush. In order to maximize performance, we generally would want the most efficient flushes of log files to disk – which often means we actually want fewer, larger, log flushes versus tons of very tiny ones causing repeated calls back to disk.
Which brings us back to our WHILE Loop.
How Can We Tell What The WHILE Loop is Doing?
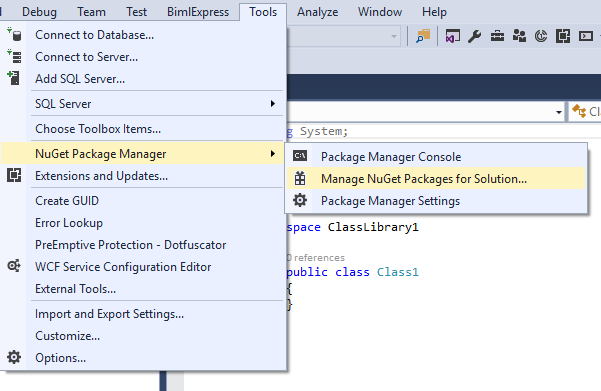
So with that background out of the way, lets take a closer look at exactly what is happening when our above script is running. Microsoft was kind enough to provide us with a number of Performance Monitor (in Windows 10, just start typing “Perf” at the Start Menu to find it) counters that we can use to see the details of the log flush activity within SQL Server.
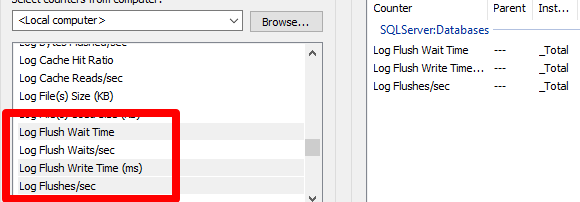
Click on the + to add new performance counters, scroll down to the SQLServer:Databases category, and then select the below three log flush related items.
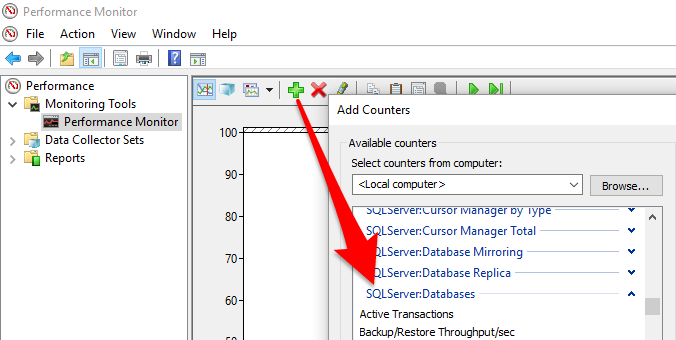
Select Log Flush Wait Time, Log Flush Write Time, and Log Flushes/sec (Log Flush Waits/sec tends to overlap on the graph with Log Flushes/sec, so we will leave it out).
Now click OK and lets re-run the WHILE Loop script from above to INSERT another 500k records.
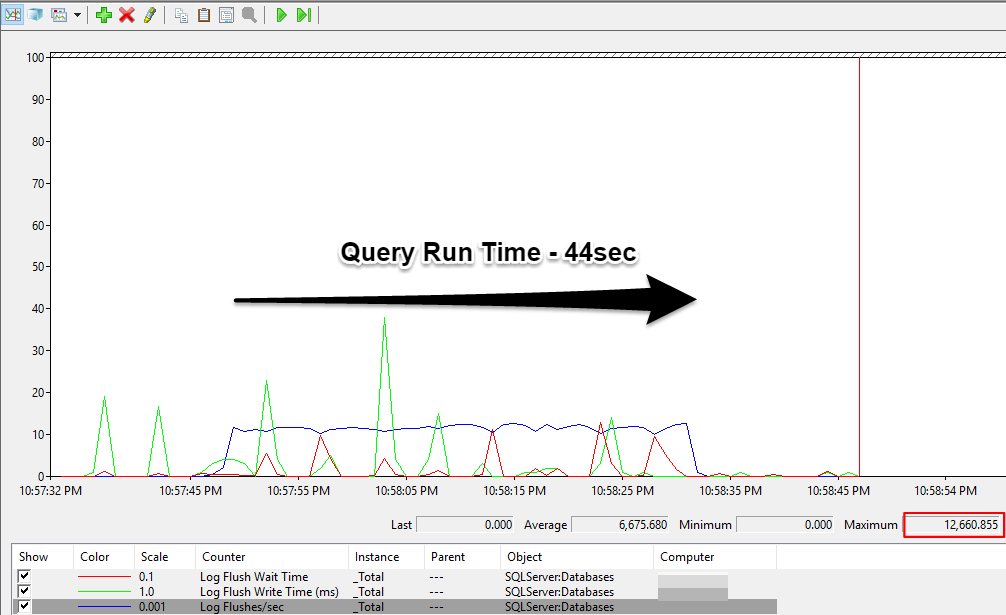
Your mileage will vary, but you should get graphs similar to the above. You can see that right around 10:57:45 the query starts, log flushes/sec jumps and so do the wait and write times. It’s a little confusing because the scales are different for each counter, but if you highlight one of the counters in the pane at the bottom, you can see the Last/Average/Min/Max values. You can see above (if its not too small to read) that the max value for Log Flushes/sec (blue line, just above 10 on the vertical axis) was ~12,500. You can’t tell exactly from the graph, but the query ran for 44 seconds. Of course we need to take into account the roughness of the calculation, but 44sec x 12,500 log flushes/sec = 550,000 log flushes. Which is right around our 500k row mark! So from this we can infer that there was essentially one log flush, and one write to disk, for every. Single. Row. Which makes sense because, with the WHILE Loop, each iteration of the loop – unless otherwise specified – is treated as a single transaction to be committed.
*Honestly I was kind of surprised when I did the math and it worked out…
Wrapping it Up
Now lets tweak the query by wrapping it in a BEGIN TRAN and COMMIT.
DECLARE @Iterations int = 500000

DECLARE @Counter int = @Iterations

BEGIN TRAN

WHILE @Counter > 0

BEGIN

INSERT INTO [dbo].[MyTable]

([SomeText]

,[MoreText])

VALUES

('Num:' + CONVERT(varchar,@Counter)

,CONVERT(varchar,@Counter) + ' bottles of beer on the wall')

SET @Counter = @Counter - 1

END

COMMIT TRAN
Now lets clear the performance counters, select the same ones, and run the new query.
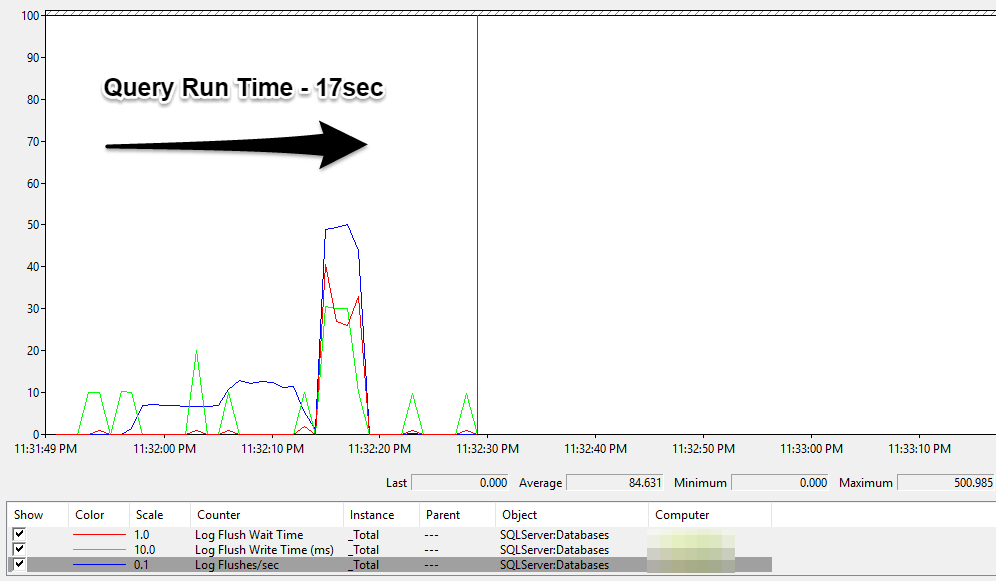
This time the query took 17 seconds, and as you can see (*the scale is different by a factor of 100 this time), there were substantially less log flushes this time. In fact, the max this time was only 500 log flushes/sec. What this tells us is that by wrapping the WHILE Loop of INSERTS inside one transaction, SQL waits until the log buffer is full with ~60KB of log records before flushing it to disk. This leads to many fewer I/O calls, and thus a big improvement in performance by doing fewer, but larger, writes to the log file.
I’m not exactly sure why there is the small ramp up, then the jump to 500 flushes/sec, but I was able to reproduce a similar pattern during multiple attempts. If anyone has an explanation, please leave it in the comments!
Summary
In this example we saw that depending on how you work with transactions, and by extension log flushes, a WHILE Loop can behave very differently. Depending on how transactions are structured, you may run in to different bottlenecks, such as the WRITELOG wait type, which cause your query to run slower than expected. Using Performance Monitor, we were able to find the cause of the WRITELOG wait type, log flushes, and measure how small changes to the query can affect this underlying performance issue.


 🙁
🙁